MicaSense RedEdge-P Dual Multispectral Kit
Vendor Part Number
805-00106
$15,995.00
- 10 multispectral bands at 1.6 MP each
- Panchromatic band for sharper imagery
- Coastal blue band for water vegetation analysis and weeds identification
- Spectral narrow bands for more precise data
- Double calibration for time series analysis
- Global shutter for distortion-free image captures.
- Up to 3 images/second
- Synchronized capture of all 10 bands
- Comes with DLS light sensor and CRP calibrated reflectance panel
In stock & ready to ship
OR


Double the analysis potential with MicaSense RedEdge-P Dual
The MicaSense RedEdge-P Dual represents a sophisticated aerial sensor designed for the classification of vegetation, identification of weeds, environmental research, conservation efforts, and comprehensive analysis of aquatic plant life.
Key features
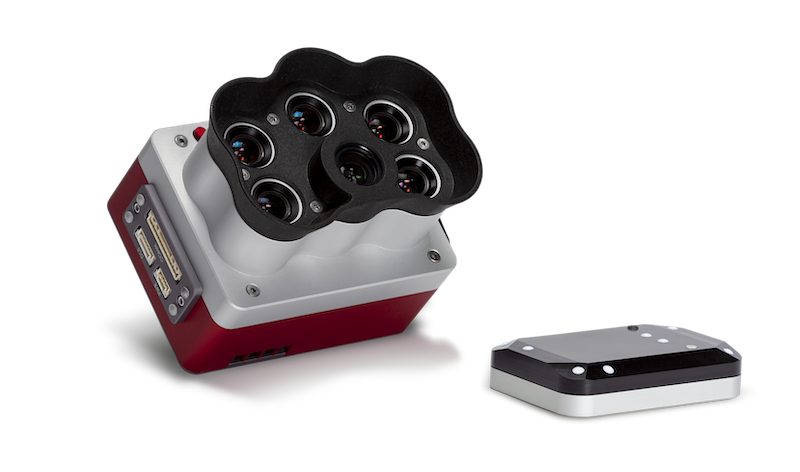
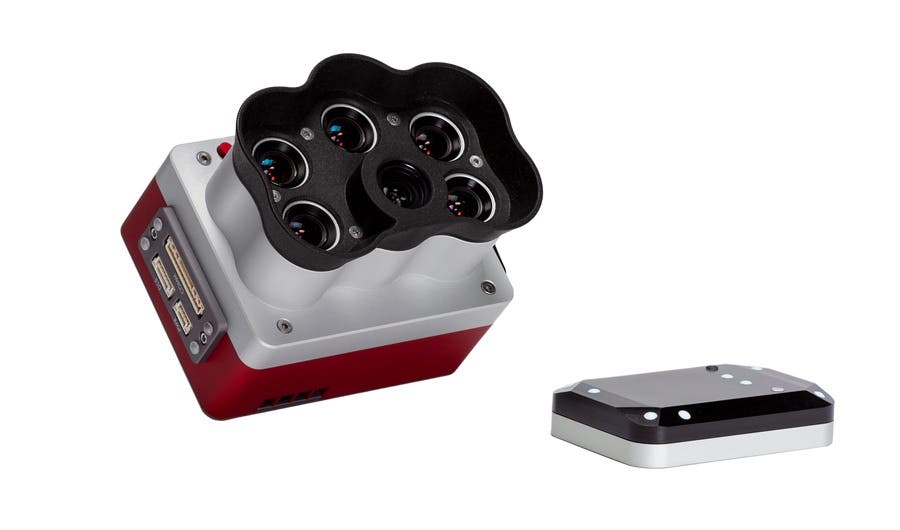
The dual configuration of this payload features both the established RedEdge-P camera and the recently introduced RedEdge-P Blue camera, combining high-resolution multispectral and RGB composite capabilities to provide a versatile solution and a set of features including the following:
- 10 multispectral bands
The dual bands of the RedEdge-P encompass the spatial resolutions of Landsat 8 and Sentinel-2 satellite bands, but in an improved manner.
- Panchromatic band for enhanced resolution
The dual configuration enables a GSD of 2 cm per pixel / 0.8 inches per pixel, achievable during flights at an altitude of 60 meters / 200 feet. This heightened image clarity facilitates the early detection of minor issues, empowering informed and dependable decision-making processes.
- Coastal blue band
The coastal blue band is specially designed for water vegetation analysis and weeds identification in shallow water environments.
- Narrow bands
The utilization of spectral narrow bands plays a pivotal role in discerning nuanced fluctuations in plant health, thereby obtaining more accurate and refined data. The MIcaSense RedEdge-P Dual, functioning as a narrow-band sensor, adeptly captures the most pertinent sections of the spectral curve.
- Double calibration
The DLS light sensor and CRP reflectance panel stand out as unparalleled offerings within the industry. They facilitate the capture of precise and dependable data under diverse lighting scenarios, thereby enabling the execution of time series analyses with confidence.
- Global shutter
Across all ten lenses, resilience to vibration is maintained without compromising image integrity. The global shutter feature of the RedEdge-P Dual ensures distortion-free image capture.
- Up to 3 images/second
The 128 GB CFexpress card facilitates the capability to conduct up to three captures per second, with the convenience of swiftly changing cards between flights for seamless and prompt turnaround.
- Synched capture
Simultaneous capture of data across all ten bands, automated initiation of capture, and the geotagging of images combine to optimize flight durations and streamline post-processing procedures.
For your workflow efficiency
You have two cameras, but you get greater efficiency under one workflow.
Drone and satellite data correlation
The RedEdge-P Dual sensor's spectral coverage aligns with Landsat 8 and Sentinel-2 satellite bands (~10 m / 32 ft per pixel) while providing an enhanced spatial resolution of 2 cm / 0.8 inches per pixel. This capacity allows for the utilization of numerous indices already established through satellite data.
Time-series analysis
Included in the RedEdge-P Dual multispectral kit are essential tools, namely a Calibrated Reflectance Panel (CRP) and a Downwelling Light Sensor (DLS). These tools, calibrated for varying weather and lighting conditions, contribute data that supports dependable time-series analysis and facilitates the comparison of outputs over time.
AI applications
The panchromatic band enables the capture of high-resolution RGB and multispectral imagery, making it ideal for machine learning applications such as early-stage crop counting.
Compatibility with versatile software
Designed to be utilized with the DJI Matrice 300 drone, the RedEdge-P Dual sensor boasts an open API interface, allowing effortless integration with a wide array of flight planning and post-processing software, including Measure Ground Control.
Insights the naked eye can’t see
By simultaneously capturing data from all spectral bands, the dual sensor enables the generation of multiple high-resolution outputs and indexes, including RGB, NDVI, NDRE, OSAVI, NIT, CIR, DSM, and more, unveiling imperceptible details to the naked eye.
The RedEdge-P Series sensors, produced in the United States in accordance with NDAA regulations, have been in use across global academic, private, and governmental establishments since 2014.
Learn more about the MicaSense RedEdge-P Dual by downloading this product brochure.
| Weight | 745 g / 26.2 oz (two sensors, mounting hardware, DLS2, and cable) |
| Dimensions | 13.2 cm x 8.8 cm x 9.67 cm / 5.1 in x 3.1 in x 3.5 in |
| Spectral brands |
Coastal blue 444(28)* Blue 475(32), Green 531(14)* Green 560(27), Red 650(16)* Red 668(14) Red Edge 705(10)* Red Edge 717(12) Near-IR 740(18)* Near-IR 842(57) |
| RGB output | 5.1 MP** (global shutter, aligned with all bands) |
| Sensor resolution |
1456 x 1088 (1.6 MP per multispectral band) 2464 x 2056 (5.1 MP panchromatic band) |
| Ground sample distance |
7.7 cm / 3 in per pixel (per multispectral band) at 120 m / ~400 ft AGL 3.98 cm / 1.5 in per pixel (panchromatic band) at 120 m / ~400 ft AGL |
| Field of view | 50° HFOV x 38° VFOV (multispectral), 44° HFOV x 38° VFOV (panchromatic) |
| Capture rate | Up to 3 images per second raw DNG |
| Storage | CFexpress card |
| Interfaces | Three configurable GPIO: select from trigger input, PPS input, PPS output, and top of frame signals. Host virtual button. USB 2.0 port for WiFi. Serial. 10/100/1000 Ethernet. |
| External power | 7.0 V - 25.2 V |
| Power input | 11/14.0/20W (standby, average, peak) |
| Heat |
Ambient without airflow: 0-40 °C / 0-104 °F Ambient with airflow >0.5 meter per second / >1.1 mph: 0-50 °C / 0-122 °F |
| IP rating |
IP4X |
*Denote RedEdge-P blue bands. **With appropriate post-processing.
Note: Specifications are subject to change without notice.
- RedEdge-P
- RedEdge-P blue
- DLS light sensor
- CRP calibrated reflectance panel
- USB Wi-Fi dongle
- Lens cover
- Integration cables
- Mounting hardware
- CFexpress card
- CFexpress card reader
- Hard carrying case
- Start guide
Related Products
Top customer reviews
No reviews
Write Your Own Review